Faceless geography channel ideas, map data, and licenses
In geography the map is the argument: build it from named, dated data, show disputed borders as disputed, and credit open map data the way its license requires.
By NoFaceTube Editorial Published 6 min read Not yet reviewed by the editor
- Policy risk
- Low
- Production bar
- High
- Formats
-
- Animated map explainer
- Border and boundary story
- Data map comparison
- Satellite before-and-after
- One-map Shorts
- Platforms
- YouTube YouTube Shorts TikTok Instagram Reels
On this page
A good map shows the viewer something a paragraph cannot. The bar is cartographic: the right data, the right projection, accurate borders, and animation that serves the point instead of decorating it.
What high quality looks like in geography
- Named, dated data: every map that shows data says where the data came from and what year it describes, on screen.
- The right projection for the claim: size comparisons need an equal-area projection, and the viewer deserves to know which projection is on screen when the point depends on it.
- Accurate borders: disputed borders are shown as disputed, with each claim labeled. Historical maps use the borders of their date.
- Legible on a phone: labels, legends, and scale bars readable at small sizes and in vertical crops.
- Explanation, not just observation: “This border is strange” is an observation. Why it was drawn that way, by whom, and with what consequences is the video.
Formats that hold up
None of these work with borrowed maps; each depends on cartography you make yourself. The faceless video styles guide has the production detail for map and data animation.
- Animated map explainer: one question answered through a sequence of original maps.
- Border and boundary story: the history and logic of a single line on the map.
- Data map comparison: one variable mapped carefully, with the source and year on screen.
- Satellite before-and-after: one measurable change in a coastline, river, forest, or city over time.
- One-map Shorts: a single map that explains one surprising fact, cut as soon as the explanation lands. Use the Short length calculator and the Short length guide to fit the idea to the platform. TikTok’s Creator Rewards program needs videos of about a minute or more (its support page says “at least” one minute, its launch post “over” a minute) (TikTok), so a single-map clip under a minute will not qualify there.
The production bar
Research and sourcing
Use authoritative datasets and read their documentation: what was measured, when, and how. Cross-check any figure that surprises you. Keep the source and year with every map file.
Script
Lead with the question the map answers. Avoid single-cause explanations, since terrain, history, politics, and economics usually all play a part. Often the original angle is a familiar map seen through one unfamiliar variable.
Voice
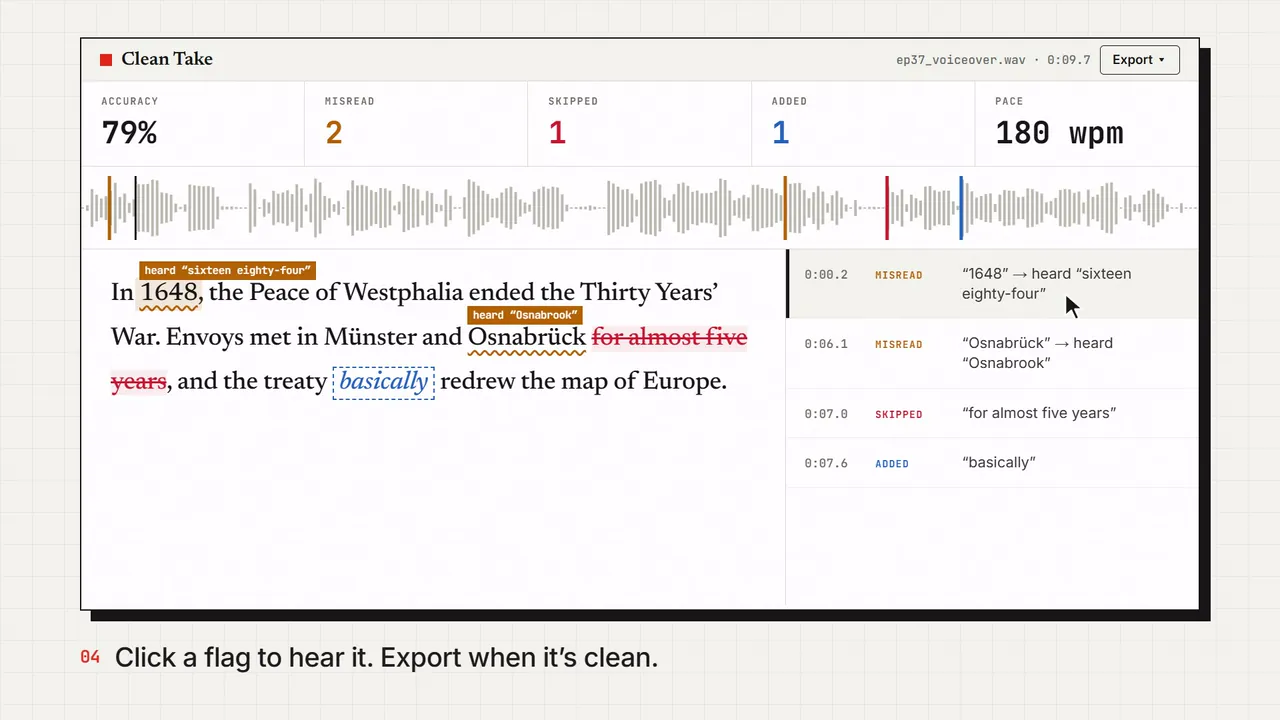
Place names need a pronunciation list. Decide when you will use local names and when you will use the English names, and stay consistent. The AI voiceover guide covers delivery. A voice that drifts from the list mid-video is hard to catch by ear; Clean Take, our own voiceover checker, marks every word that differs from the script.
Visuals
Build a consistent map style: one palette, one type system, one way of drawing borders and labels. Animate only to reveal information in order. Design vertical crops for Shorts rather than squeezing a horizontal map.
Sound
Small, consistent cues for map transitions and reveals help the viewer follow. Keep music under the narration.
Sourcing visuals legally
Building maps from open data is the strongest position, legally and creatively. Each dataset has its own license. None of this replaces legal advice; it is how the main open datasets describe their own terms.
- Natural Earth: public domain. Its terms say “no permission is needed to use Natural Earth. Crediting the authors is unnecessary” (terms of use). A good base layer for country, coastline, and physical maps.
- OpenStreetMap: OpenStreetMap data is licensed under the Open Database License. Where you use it, OpenStreetMap says you must credit it with an attribution notice and make clear the data is available under the ODbL; ”© OpenStreetMap contributors” is the familiar form (copyright page). The OpenStreetMap Foundation’s attribution guidelines explain where the credit can go.
- Copernicus Sentinel imagery: the EU’s legal notice grants free, full, and open access, and asks for the credit “Contains modified Copernicus Sentinel data [Year]” on anything you process (legal notice). Imagery that ESA itself has processed is a separate case: ESA releases it under CC BY-SA 3.0 IGO (ESA).
- Landsat: USGS treats Landsat data as a public-domain record with no restrictions on use or redistribution, and asks only that you name USGS as the source (USGS). Decades of archive make it the natural source for long before-and-after sequences.
- NASA imagery: NASA’s guidelines say its imagery is, as a rule, free of U.S. copyright, but keep its insignia and logotype off limits and bar uses that imply NASA endorses you (NASA guidelines).
- Wikimedia Commons maps: many maps there are share-alike, and the license sits on each file page, not on the site as a whole (Commons reuse guide).
- Commercial map and globe software: screen-recording a map app or a commercial satellite basemap is governed by that service’s terms. Read them before you record, or build the map yourself.
Keep a credits block in every description listing each dataset, its license, and the required attribution. Never trace or re-skin another creator’s map. That fails the Standard’s transformation criterion and invites a copyright claim.
Slop tells to avoid
- Borders that are wrong, outdated, or shown as settled when they are disputed.
- The same spinning stock globe in every intro.
- Size comparisons made on a projection that does not preserve area.
- Data maps with no source and no year.
- Generated maps with garbled labels and invented coastlines.
- Rainbow color scales that make small differences look dramatic.
- “Top 10 weirdest borders” lists with no explanation of any of them.
- A capital city given a new pronunciation every time it comes up.
- A rendered globe presented as satellite imagery.
Policy and advertiser-suitability risks
Geography’s policy risk is low: the subject rarely touches the sensitive categories in the advertiser-friendly guidelines. War maps and active conflicts are the exception, and there the line YouTube draws is graphic footage. Non-graphic educational coverage of a conflict can earn full ads, raw conflict footage without educational framing earns limited ads, and graphic war footage earns none. These guideline details were last checked on 5 October 2026.
The more common risks are:
- Generated imagery of real places: a photorealistic generated “satellite view” of a real city falls under YouTube’s synthetic content rule, which covers realistic content that alters footage of a real place or fabricates a realistic scene (YouTube Help). A stylized map does not. When a map crosses into photorealism, the AI disclosure guide explains what to label.
- Templated uploads: a channel that swaps the country name into the same map template every day is the pattern YouTube describes as generic or repetitive content (monetization policies).
- Misleading titles: “This country is about to disappear” over a video about slow coastal change can break YouTube’s rules on misleading metadata in its spam and deceptive practices policies.
- Static maps on TikTok: TikTok’s Creator Rewards rules treat single or multiple photos, and videos with only text overlays, as unoriginal (TikTok). Animate the map.
Channel ideas worth making
- The border’s paperwork: explain one boundary through the treaty, survey, or commission that drew it, with the document as the evidence.
- One river, many maps: show how a single river or region is drawn differently by different countries or eras, and why.
- The size comparison, redone: re-run a popular size comparison in an equal-area projection and show exactly what changes.
- Why the city is there: explain one city’s location from terrain, water, and old maps, rather than from a list of facts.
- Decades from orbit: a satellite sequence of one coastline, delta, or city built around one measurable change.
- The name on the map: how a place got its name and who uses which name today, which often turns on language and politics.
- The map that was wrong: a historical map’s errors and what they reveal about the people who made it.
Sources
- 1Terms of useNatural Earth
- 2Copyright and LicenseOpenStreetMap
- 3Licence/Attribution GuidelinesOpenStreetMap Foundation
- 4Open Data Commons Open Database License (ODbL) v1.0Open Data Commons
- 5Legal Notice on the use of Copernicus Sentinel Data and Service InformationCopernicus / ESA
- 6Copernicus Sentinel satellite imagery under open licenceEuropean Space Agency
- 7Are Landsat data in the cloud still considered to be within the public domain?U.S. Geological Survey
- 8Guidelines for using NASA images and mediaNASA
- 9Commons: Reusing content outside WikimediaWikimedia Commons
- 10Advertiser-friendly content guidelinesYouTube Help
- 11Disclosing use of GenAI contentYouTube Help
- 12YouTube channel monetization policiesYouTube Help
- 13Spam, deceptive practices, and scams policiesYouTube Help
- 14TikTok Creator Rewards ProgramTikTok Creator Academy
Spotted an error or a dead source link? Send a correction.